Integrating OpenTelemetry#
What is OpenTelemetry?#
OpenTelemetry is an open-source observability framework for traces, metrics, and logs. It is a merger of OpenCensus and OpenTracing projects hosted by Cloud Native Computing Foundation.
OpenTelemetry allows developers to collect and export telemetry data in a vendor agnostic way. With OpenTelemetry, you can instrument your application once and then add or change vendors without changing the instrumentation, for example, here is a list of popular DataDog competitors that support OpenTelemetry.
What is tracing?#
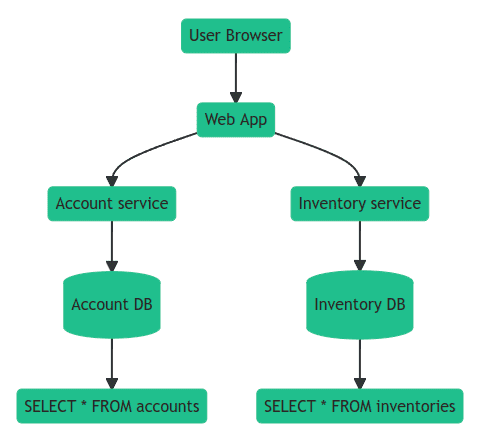
OpenTelemetry tracing allows you to see how a request progresses through different services and systems, timings of each operation, any logs and errors as they occur.
In a distributed environment, tracing also helps you understand relationships and interactions between microservices. Distributed tracing gives an insight into how a particular microservice is performing and how that service affects other microservices.
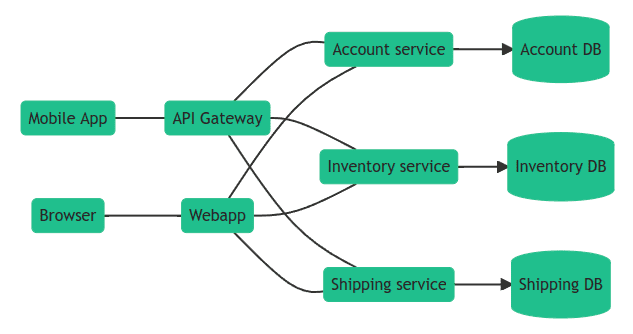
Using tracing, you can break down requests into spans. Span is an operation (unit of work) your app performs handling a request, for example, a database query or a network call.
Trace is a tree of spans that shows the path that a request makes through an app. Root span is the first span in a trace.
To learn more about tracing, see Distributed Tracing using OpenTelemetry.
Native OpenTelemetry Integration (Recommended)#
redis-py includes built-in support for OpenTelemetry metrics collection. This native integration is the recommended approach as it provides comprehensive metrics without requiring external instrumentation packages.
Installation#
To use native OpenTelemetry support, install the required dependencies:
pip install redis[otel]
Basic Setup#
Initialize OpenTelemetry observability once at application startup. All Redis clients will automatically collect metrics:
from opentelemetry import metrics
from opentelemetry.sdk.metrics import MeterProvider
from opentelemetry.sdk.metrics.export import PeriodicExportingMetricReader
from opentelemetry.exporter.otlp.proto.http.metric_exporter import OTLPMetricExporter

# 1. Set up OpenTelemetry MeterProvider
exporter = OTLPMetricExporter(endpoint="http://localhost:4318/v1/metrics")
reader = PeriodicExportingMetricReader(exporter=exporter, export_interval_millis=10000)
provider = MeterProvider(metric_readers=[reader])
metrics.set_meter_provider(provider)

# 2. Initialize redis-py observability
from redis.observability import get_observability_instance, OTelConfig

otel = get_observability_instance()
otel.init(OTelConfig())

# 3. Use Redis as usual - metrics are collected automatically
import redis
r = redis.Redis(host='localhost', port=6379)
r.set('key', 'value')  # Metrics collected automatically
r.get('key')

# 4. Shutdown observability at application exit
otel.shutdown()
Configuration Options#
The OTelConfig class provides fine-grained control over metrics collection:
from redis.observability import OTelConfig, MetricGroup

config = OTelConfig(
    # Metric groups to enable (default: CONNECTION_BASIC | RESILIENCY)
    metric_groups=[
        MetricGroup.CONNECTION_BASIC,    # Connection creation time, relaxed timeout
        MetricGroup.CONNECTION_ADVANCED, # Connection wait time, timeouts, closed connections
        MetricGroup.COMMAND,             # Command execution duration
        MetricGroup.RESILIENCY,          # Error counts, maintenance notifications
        MetricGroup.PUBSUB,              # PubSub message counts
        MetricGroup.STREAMING,           # Stream message lag
        MetricGroup.CSC,                 # Client Side Caching metrics
    ],

    # Filter which commands to track
    include_commands=['GET', 'SET', 'HGET'],  # Only track these commands
    # OR
    exclude_commands=['DEBUG', 'SLOWLOG'],    # Track all except these

    # Privacy controls
    hide_pubsub_channel_names=True,  # Hide channel names in PubSub metrics
    hide_stream_names=True,          # Hide stream names in streaming metrics
)

otel = get_observability_instance()
otel.init(config)
Available Metric Groups#
Metric Group |
Description |
|---|---|
|
Connection creation time, relaxed timeout, handoff |
|
Connection wait time, timeouts, closed connections |
|
Command execution duration |
|
Error counts, maintenance notifications |
|
PubSub message counts (publish/receive) |
|
Stream message lag (XREAD/XREADGROUP) |
|
Client Side Caching (requests, evictions, bytes saved) |
Available Metrics#
The following metrics are collected based on enabled metric groups:
Connection Metrics:
db.client.connection.create_time- Time to create a new connection (histogram)db.client.connection.timeouts- Number of connection timeouts (counter)db.client.connection.wait_time- Time to obtain a connection from pool (histogram)db.client.connection.count- Current number of connections (observable gauge)redis.client.connection.closed- Total closed connections (counter)redis.client.connection.relaxed_timeout- Relaxed timeout events (up/down counter)redis.client.connection.handoff- Connection handoff events (counter)
Command Metrics:
db.client.operation.duration- Command execution duration (histogram)
Resiliency Metrics:
redis.client.errors- Error counts with error type (counter)redis.client.maintenance.notifications- Server maintenance notifications (counter)
PubSub Metrics:
redis.client.pubsub.messages- Published and received messages (counter)
Streaming Metrics:
redis.client.stream.lag- End-to-end message lag (histogram)
Client Side Caching (CSC) Metrics:
redis.client.csc.requests- Cache requests with hit/miss result (counter)redis.client.csc.evictions- Cache evictions (counter)redis.client.csc.network_saved- Bytes saved by caching (counter)redis.client.csc.items- Current cache size (observable gauge)
Custom Histogram Buckets#
You can customize histogram bucket boundaries for better granularity:
config = OTelConfig(
    buckets_operation_duration=[0.0001, 0.0005, 0.001, 0.005, 0.01, 0.05, 0.1, 0.5, 1],
    buckets_connection_create_time=[0.001, 0.005, 0.01, 0.05, 0.1, 0.5, 1, 5],
    buckets_connection_wait_time=[0.0001, 0.0005, 0.001, 0.005, 0.01, 0.05, 0.1],
    buckets_stream_processing_duration=[0.001, 0.01, 0.1, 1, 10],
)
Context Manager Usage#
For automatic cleanup, use the context manager pattern:
from redis.observability import get_observability_instance, OTelConfig

otel = get_observability_instance()

with otel.get_provider_manager():
    # Redis operations here
    r = redis.Redis()
    r.set('key', 'value')
# Metrics are automatically flushed on exit
Error Handling#
The native integration is designed to be non-intrusive. All metric recording functions are wrapped with try-except blocks, ensuring that any errors during metric collection will not affect your Redis operations.
External OpenTelemetry Instrumentation (Alternative)#
As an alternative to the native integration, you can use the external opentelemetry-instrumentation-redis package. This approach uses monkey-patching to instrument redis-py.
Instrumentations are plugins for popular frameworks and libraries that use OpenTelemetry API to record important operations, for example, HTTP requests, DB queries, logs, errors, and more.
To install OpenTelemetry instrumentation for redis-py:
pip install opentelemetry-instrumentation-redis
You can then use it to instrument code like this:
from opentelemetry.instrumentation.redis import RedisInstrumentor

RedisInstrumentor().instrument()
Once the code is patched, you can use redis-py as usual:
# Sync client
client = redis.Redis()
client.get("my-key")

# Async client
client = redis.asyncio.Redis()
await client.get("my-key")
OpenTelemetry API#
OpenTelemetry API is a programming interface that you can use to instrument code and collect telemetry data such as traces, metrics, and logs.
You can use OpenTelemetry API to measure important operations:
from opentelemetry import trace

tracer = trace.get_tracer("app_or_package_name", "1.0.0")

# Create a span with name "operation-name" and kind="server".
with tracer.start_as_current_span("operation-name", kind=trace.SpanKind.CLIENT) as span:
    do_some_work()
Record contextual information using attributes:
if span.is_recording():
    span.set_attribute("http.method", "GET")
    span.set_attribute("http.route", "/projects/:id")
And monitor exceptions:
except ValueError as exc:
    # Record the exception and update the span status.
    span.record_exception(exc)
    span.set_status(trace.Status(trace.StatusCode.ERROR, str(exc)))
See OpenTelemetry Python Tracing API for details.
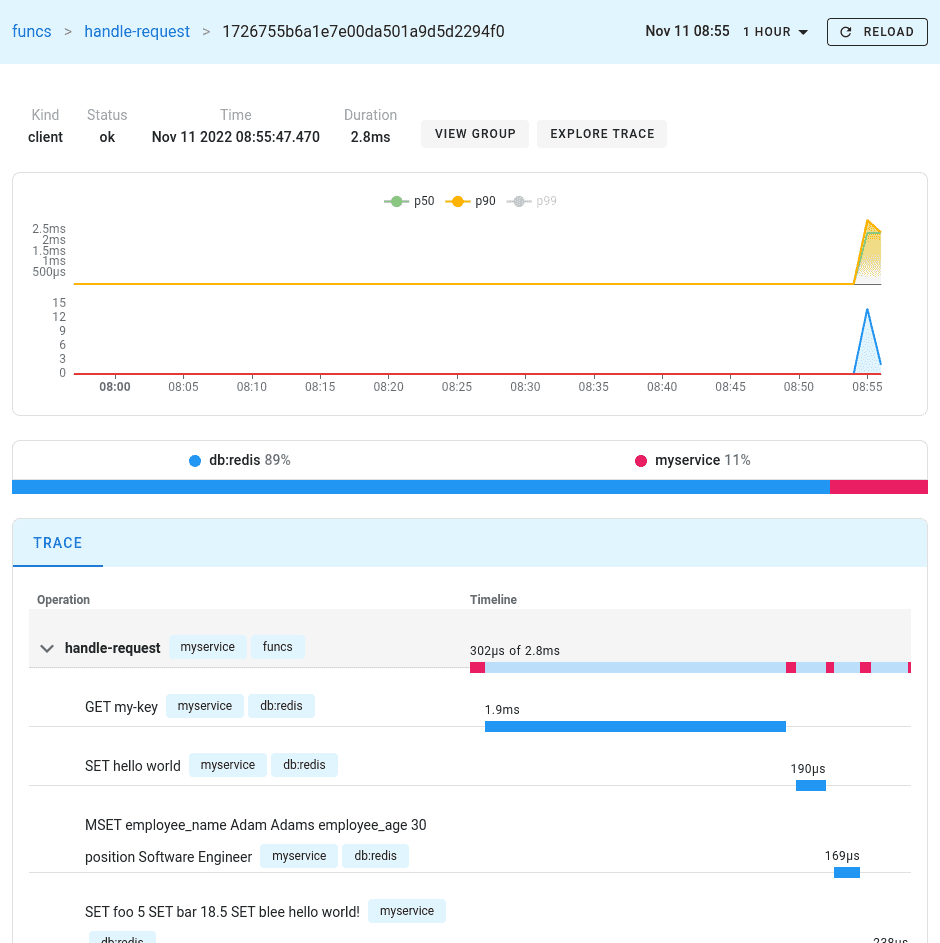
Uptrace#
Uptrace is an open source APM that supports distributed tracing, metrics, and logs. You can use it to monitor applications and set up automatic alerts to receive notifications via email, Slack, Telegram, and more.
You can use Uptrace to monitor redis-py using this GitHub example as a starting point.
You can install Uptrace by downloading a DEB/RPM package or a pre-compiled binary.
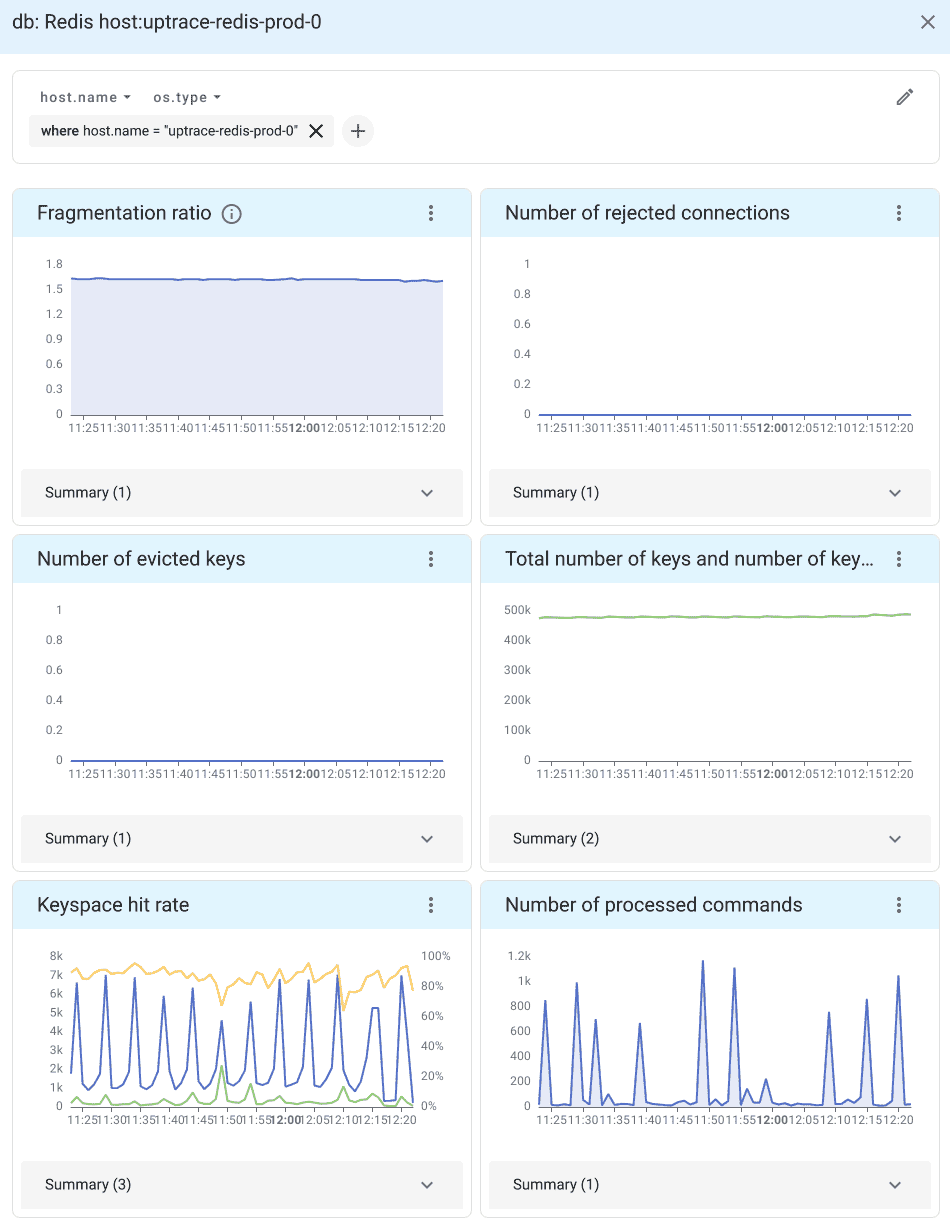
Monitoring Redis Server performance#
In addition to monitoring redis-py client, you can also monitor Redis Server performance using OpenTelemetry Collector Agent.
OpenTelemetry Collector is a proxy/middleman between your application and a distributed tracing tool such as Uptrace or Jaeger. Collector receives telemetry data, processes it, and then exports the data to APM tools that can store it permanently.
For example, you can use the OpenTelemetry Redis receiver <https://uptrace.dev/get/monitor/opentelemetry-redis.html> provided by Otel Collector to monitor Redis performance:
See introduction to OpenTelemetry Collector for details.
Alerting and notifications#
Uptrace also allows you to monitor OpenTelemetry metrics using alerting rules. For example, the following monitor uses the group by node expression to create an alert whenever an individual Redis shard is down:
monitors:
  - name: Redis shard is down
    metrics:
      - redis_up as $redis_up
    query:
      - group by cluster # monitor each cluster,
      - group by bdb # each database,
      - group by node # and each shard
      - $redis_up
    min_allowed_value: 1
    # shard should be down for 5 minutes to trigger an alert
    for_duration: 5m
You can also create queries with more complex expressions. For example, the following rule creates an alert when the keyspace hit rate is lower than 75%:
monitors:
  - name: Redis read hit rate < 75%
    metrics:
      - redis_keyspace_read_hits as $hits
      - redis_keyspace_read_misses as $misses
    query:
      - group by cluster
      - group by bdb
      - group by node
      - $hits / ($hits + $misses) as hit_rate
    min_allowed_value: 0.75
    for_duration: 5m
See Alerting and Notifications for details.
What’s next?#
Next, you can learn how to configure uptrace-python to export spans, metrics, and logs to Uptrace.
You may also be interested in the following guides: